


Analytic portfolio
#1
Data analysis using SQL and Excel.
#2
Power BI data visualization for clients.


#3
Zastosowanie wizualizacji w analizie danych biznesowych.
#4
Optymalizacja procesów analitycznych przy użyciu Excela.
ABOUT ME ->
Professional Experience
Business Data Analyst – Carfree (2024 – present)
Collecting, verifying, and analyzing sales data from across Poland.
Creating management reports and dashboards in Power BI.
Automating reporting and optimizing analytical processes.
I am 23 years old and have one year of experience working as a data analyst.Currently, I work in the automotive industry, where I am responsible for collecting, analyzing, and visualizing sales data using Excel, SQL, and Power BI.Thanks to my own optimization initiatives, I was promoted to the position of data analyst.I focus on delivering precise analyses that have a real impact on business decisions and on automating processes to increase efficiency.I am passionate about data analysis, finding patterns, and creating tools that improve daily team operations.I am constantly developing my skills and I am open to new challenges in analytics and automation.
Education
Warsaw University of TechnologyField of study: Administration (Bachelor’s degree)
Thesis: Use of Artificial Intelligence in Administration
I currently have student status.
Sales and Customer Service Specialist – Carfree (2022–2024)
Customer service in Polish and English.
Supporting the sales team and taking initiatives to improve data analysis processes.
Skills
Excel: Advanced functions, pivot tables, Power Query, VBA.
SQL: Writing queries, managing databases.
Power BI: Creating dashboards and data visualizations.
Process Automation: Improving individual and team workflows.
Communication: Teamwork and clear data reporting.
Languages
Polish – native
English – fluent in writing and speaking
Project 1


Data Cleaning
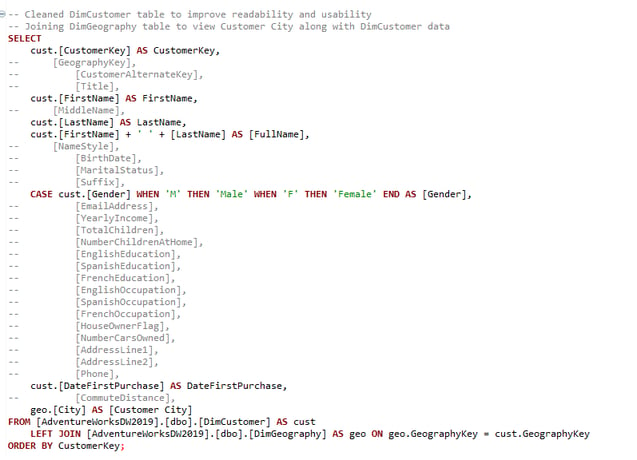
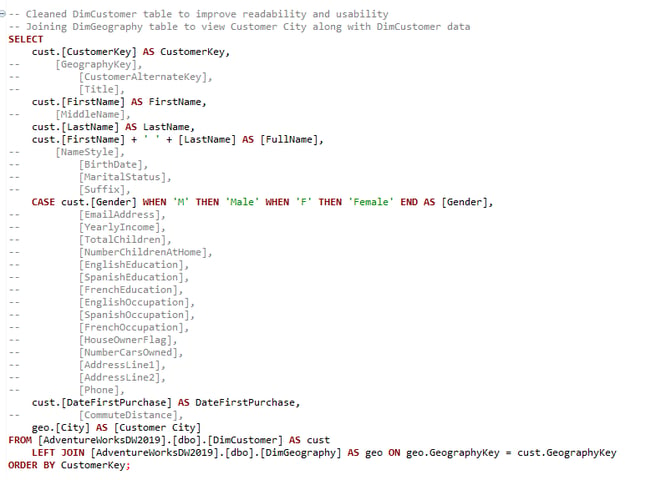
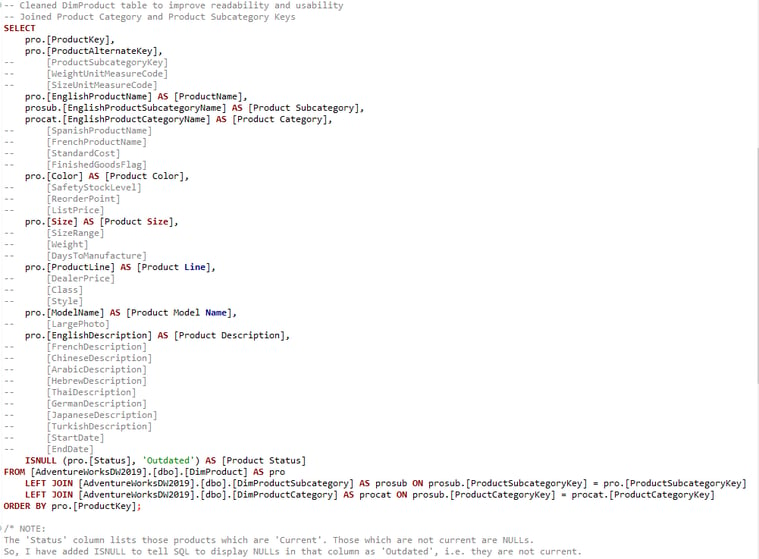
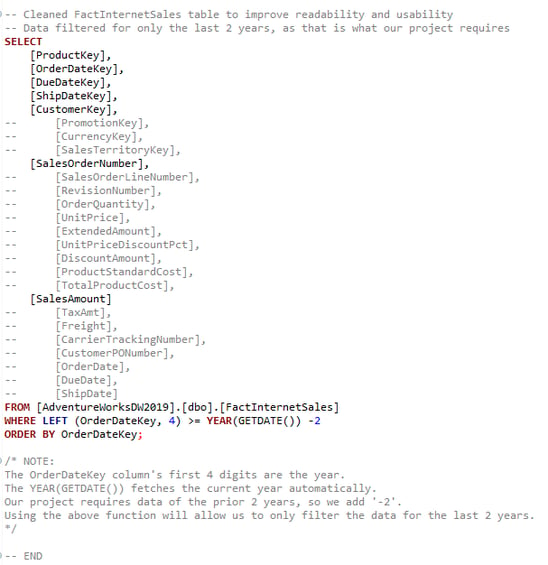
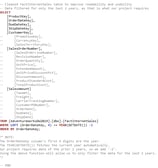
In this data cleaning, analysis and visualisation project, I clean the AdventureWorks dataset with SQL, then visualise it as an interactive 3-page dashboard with PowerBI and also export a static version of the dashboard as a PDF.
Data Analysis for AdventureWorks (SQL, PowerBI)
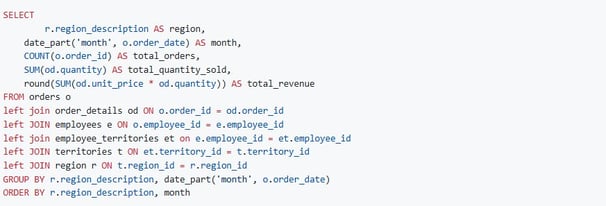
The 4 CSV data tables are the output of the SQL queries, where I clean the tables by sorting and exporting only those columns which are needed for visualisation in PowerBI.
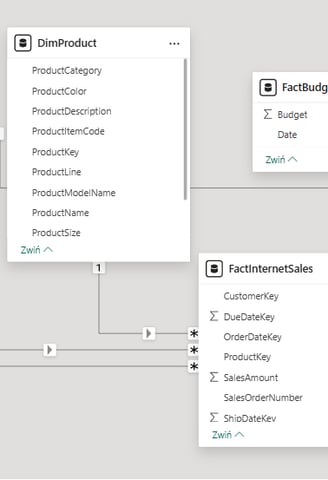
Once the cleaned data tables have been exported as CSVs, I import the 4 CSVs and the Excel worksheet into PowerBI, where I link the tables together in the "Model" side tab:
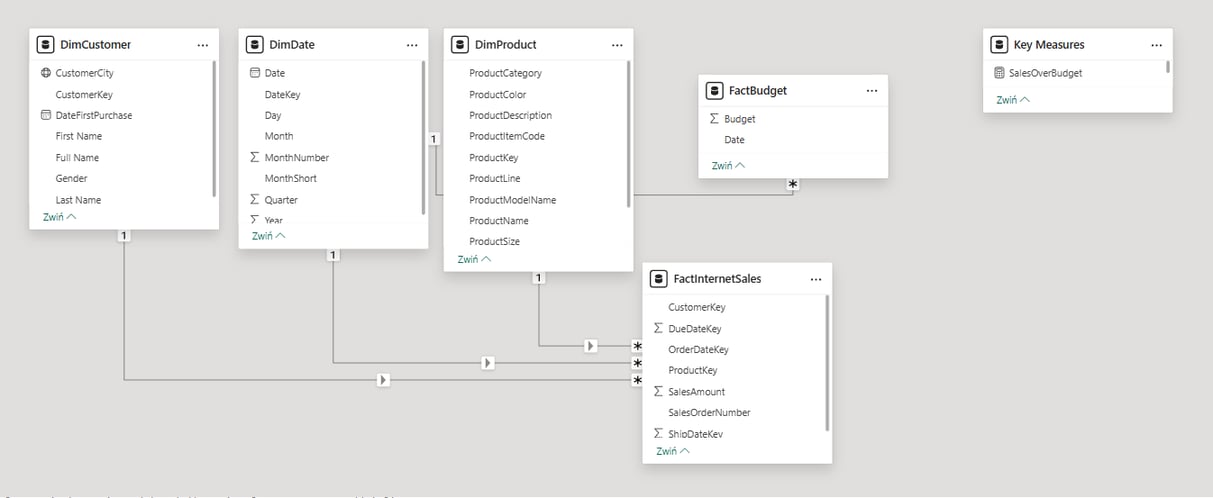
I then further process the data in Power Query ("Transform data" on the Home tab), renaming columns, changing columns' data type etc. and bring the columns into a format suitable for visualisation. Finally, I visualise the data as an interactive 3-page dashboard in PowerBI. I also export a static version of the dashboard as a PDF.
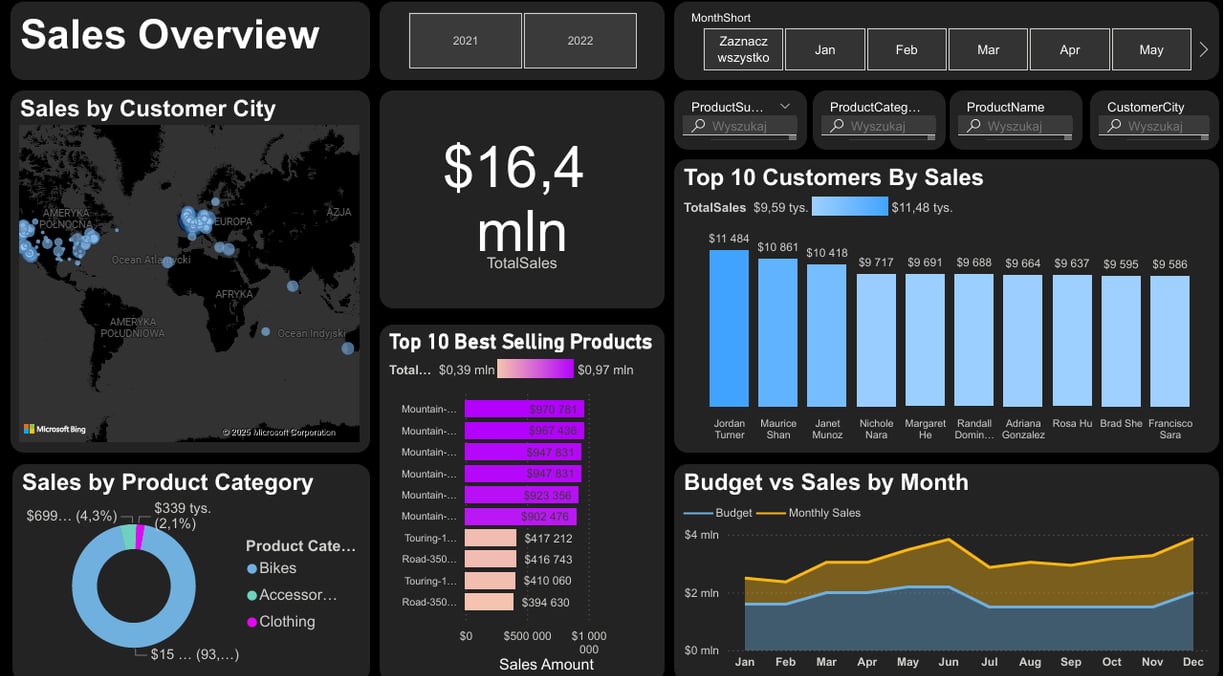
Visualization
Data
page 1
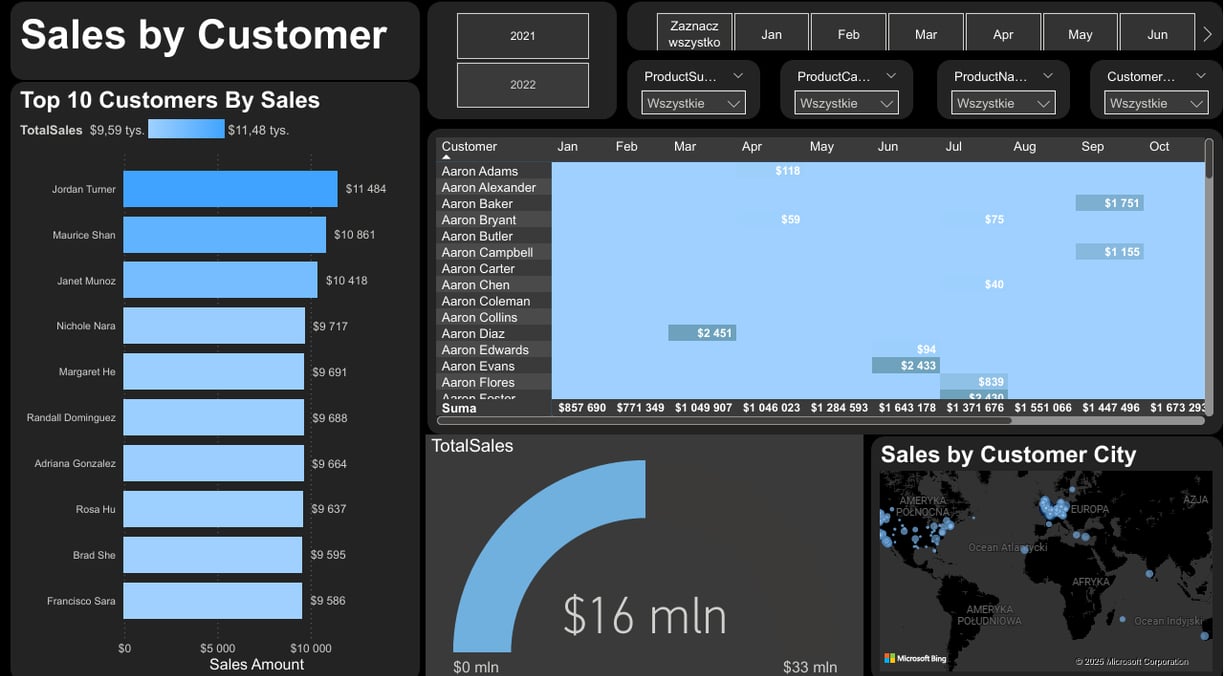
page 2
page 3
I aim to set up and automate this process as a system, where data is pulled from a database, cleaned and organised into a format suitable for visualisation, visualised in a dashboard, the dashboard is exported as a PDF and the PDF is emailed to concerned stakeholders automatically.
Project 2
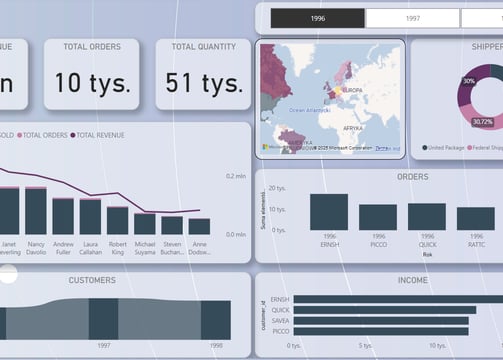
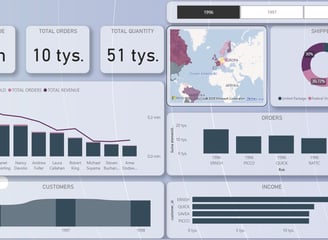
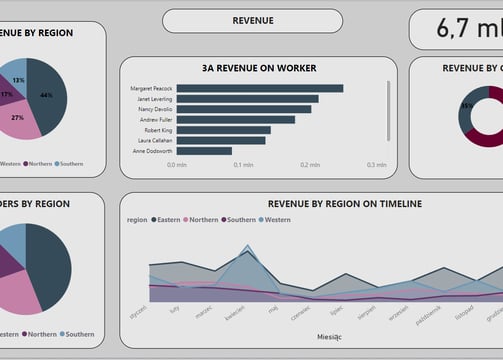
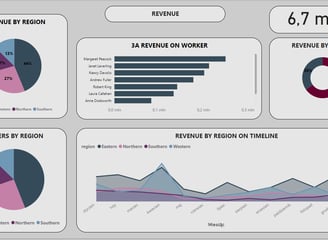
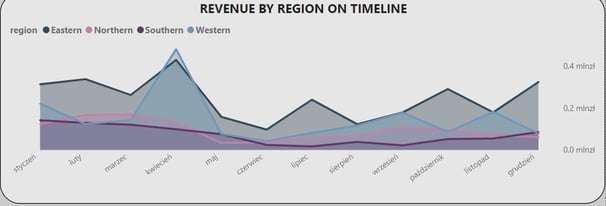
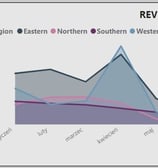
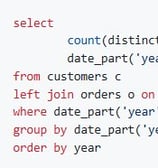
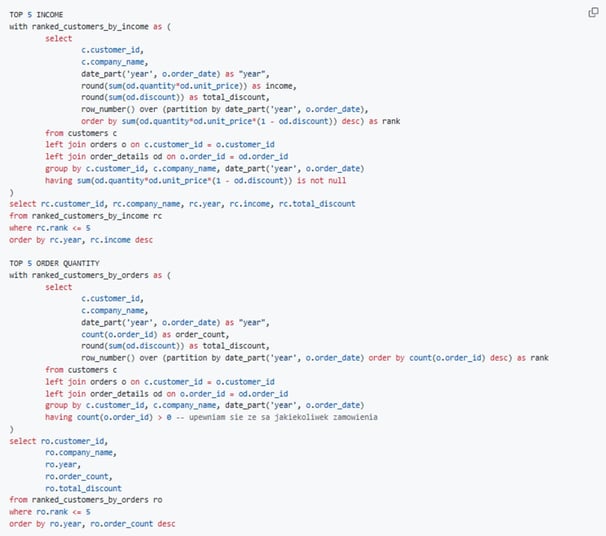
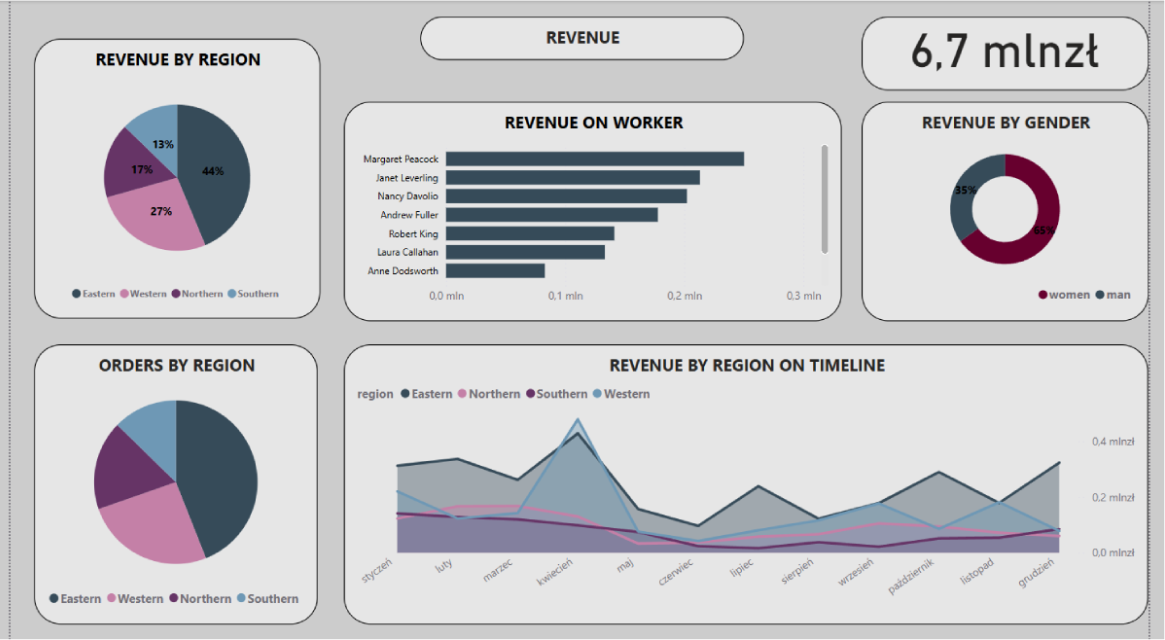
Data Analysis for Industrial Company (SQL, PowerBI)
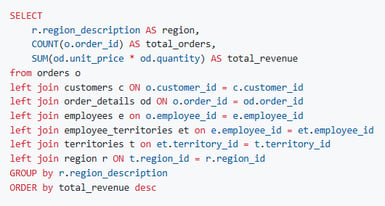
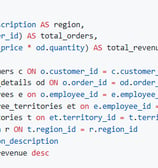
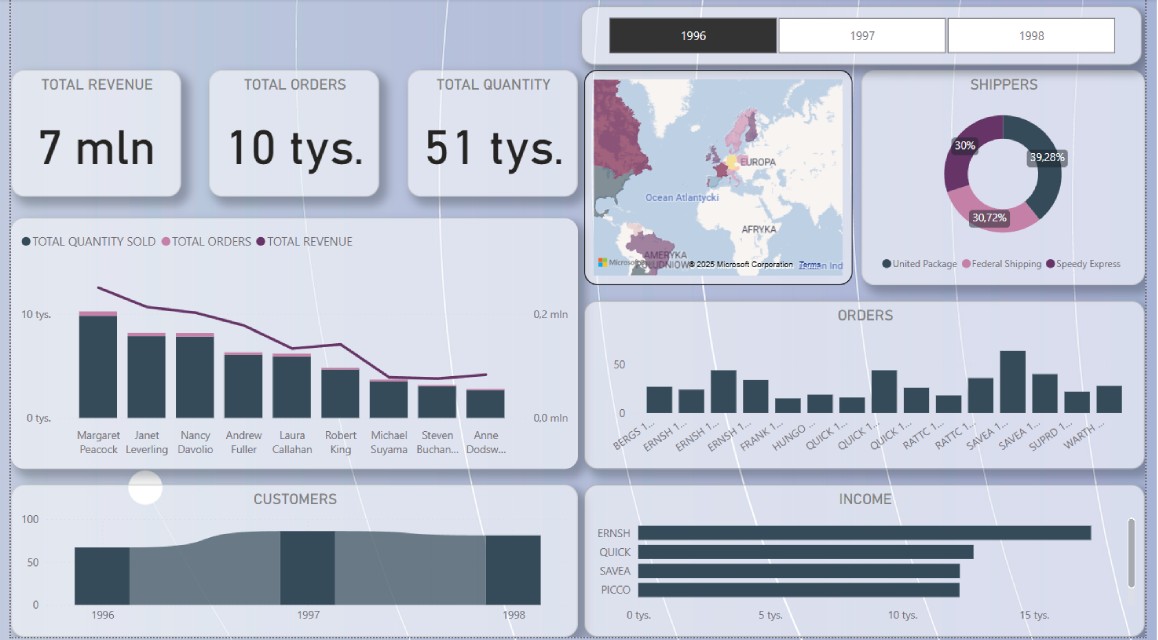
In this project I did a sample data analysis for an industrial company. I had to answer questions and make visualizations based on this company's database. The project was created for learning purposes. General questions:
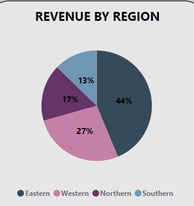
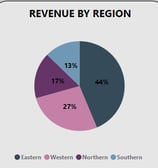
Does the region have an impact on revenue?
Is seasonality in revenue if present the same for each region?
Check what the trend of the number of customers has been over the years.


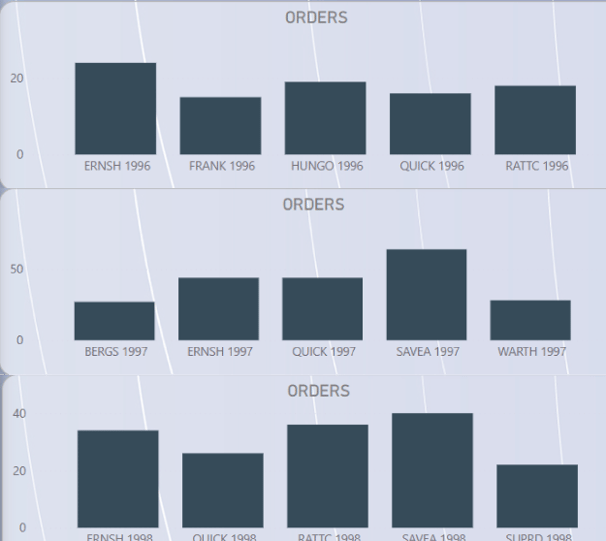
Check whether the TOP5 customers also generated the highest number of orders.
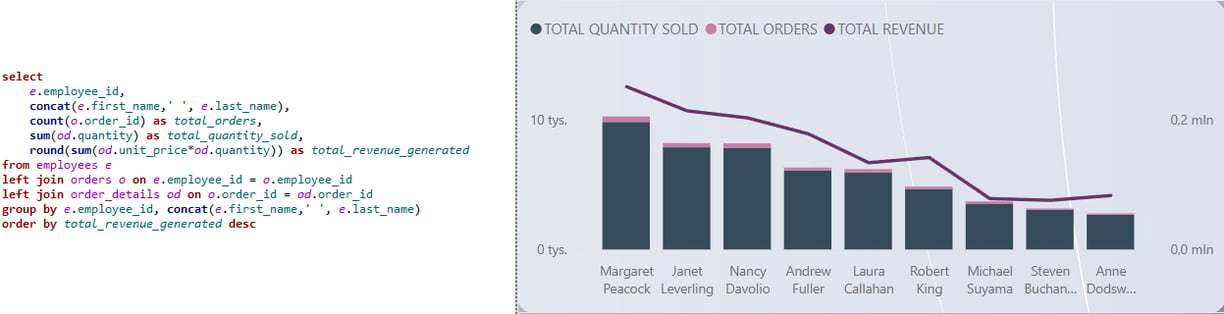
Present the size of the customer portfolio for each employee (revenue generated, number of orders, quantity sold).
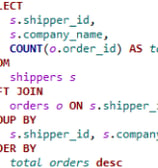
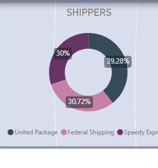
Which shipper handled the most orders?


Final Visualizations
Contact me


Contact me for data analysis, SQL, Excel or Power BI projects.